Chapter 11 · concept 4 of 6 · show all
2Tokens, cost and your first RAG
4Chunking
- 4.1Why we chunk, and the main chunking strategies
- 4.2Structure aware chunking and tables
- 4.3Chunk size, overlap and token based sizing
- 4.4Contextual chunking and late chunking
- 4.5Parent child and multi representation indexing
- 4.6Chunk metadata, provenance and the chunking debugging playbook
- Chapter overview
7Finding the right chunks
8When retrieval fails
Observability and tracing
Log enough about each request to replay it: the rewritten query, every retrieved chunk with its rank, the prompt size, each stage's time, the model and the feedback. A real trace from our pipeline shows where the time goes.
A real question
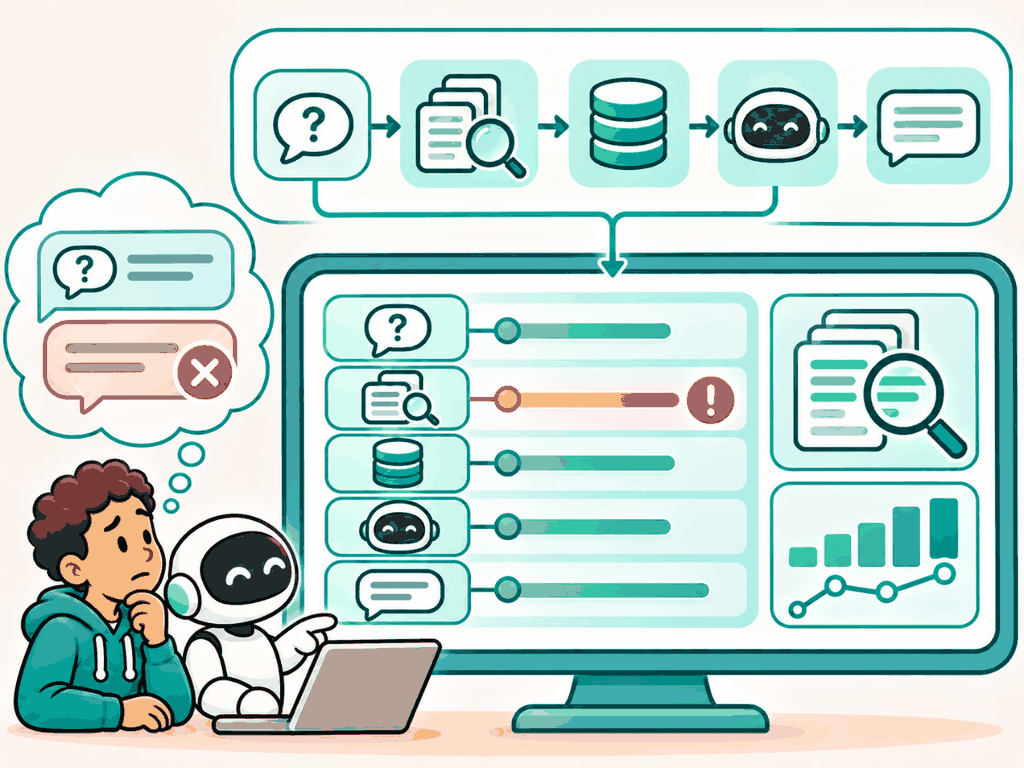
A user says yesterday's answer was wrong. Can you find out why?
Only if you logged enough. A trace records each step of one request, the query search actually used, which chunks came back at what rank, what went into the prompt and how long each step took, under one id you can look up.
The problem
Why this matters
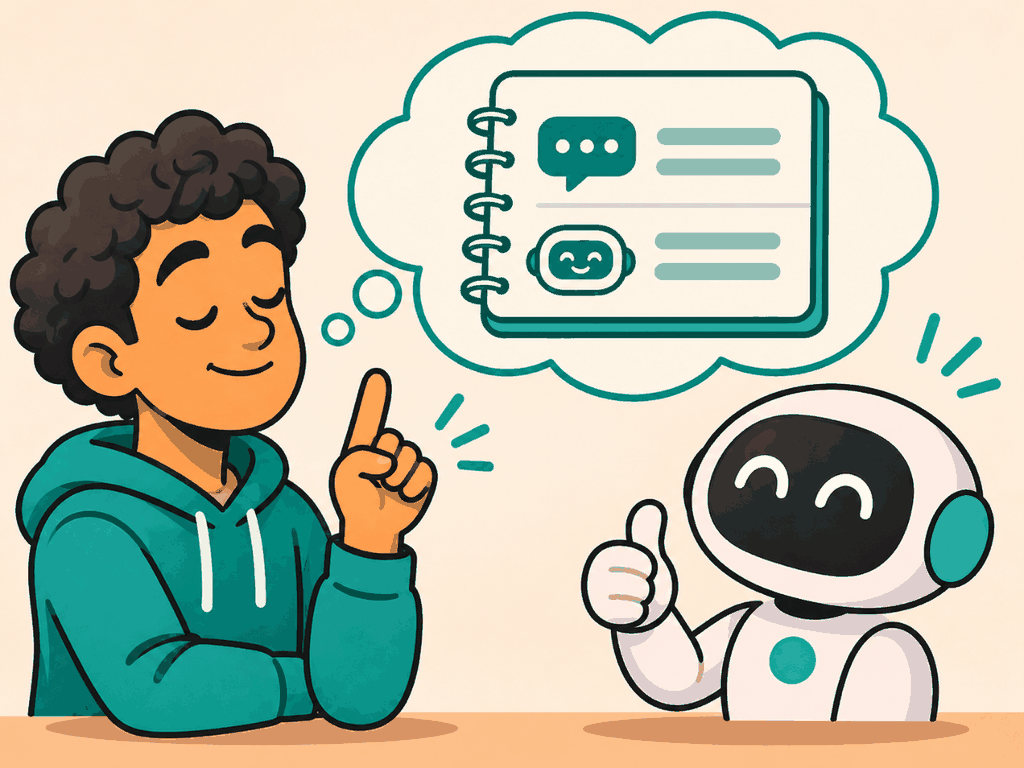
Logging the question and the answer is enough.
With only those two, a wrong answer could be a bad rewrite, a missing document, a ranking miss, a filter or the model. Logging the chunk ids and ranks per stage turns the five-step playbook (RAG-32) into a lookup.
Why not the simpler way
RAG fails in many places, and almost always quietly: a wrong answer looks just like a right one. Without traces, every investigation starts from scratch. With them, you can replay a request, see what search found and compare it with what the golden set expects.
The idea
The idea in plain words
Observability means you can understand what the system did from its outputs. Tracing is the main tool: one trace per request, made of spans, one per step, each with timing and attributes. Standards such as OpenTelemetry define the format, and many LLM tools now offer semantic conventions for model calls.
A parcel tracking page: every scan along the way, with time and place. When the parcel is late, you see exactly where it waited.
How it works
Step by step
- 1
One id per request
Create a trace id at the start, pass it through every step, return it to the client with the answer.
 2
A span per stage
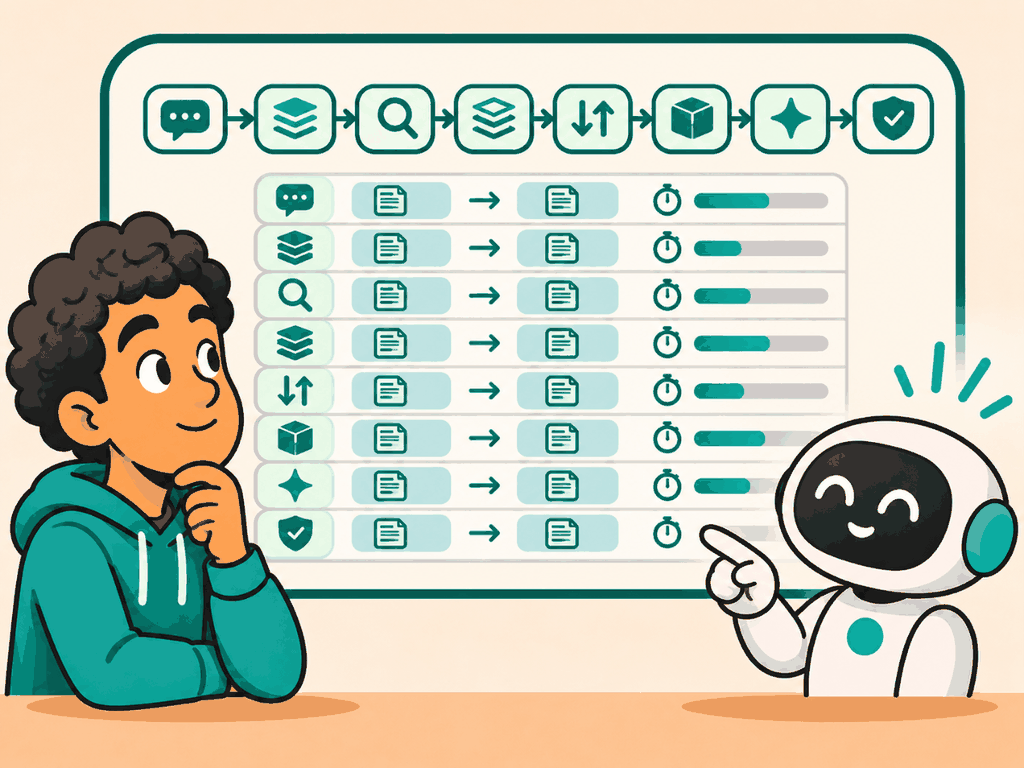
Rewrite, embed, search, fuse, rerank, pack, generate, verify: each records its inputs, outputs and time.
 3
Dashboards and alerts
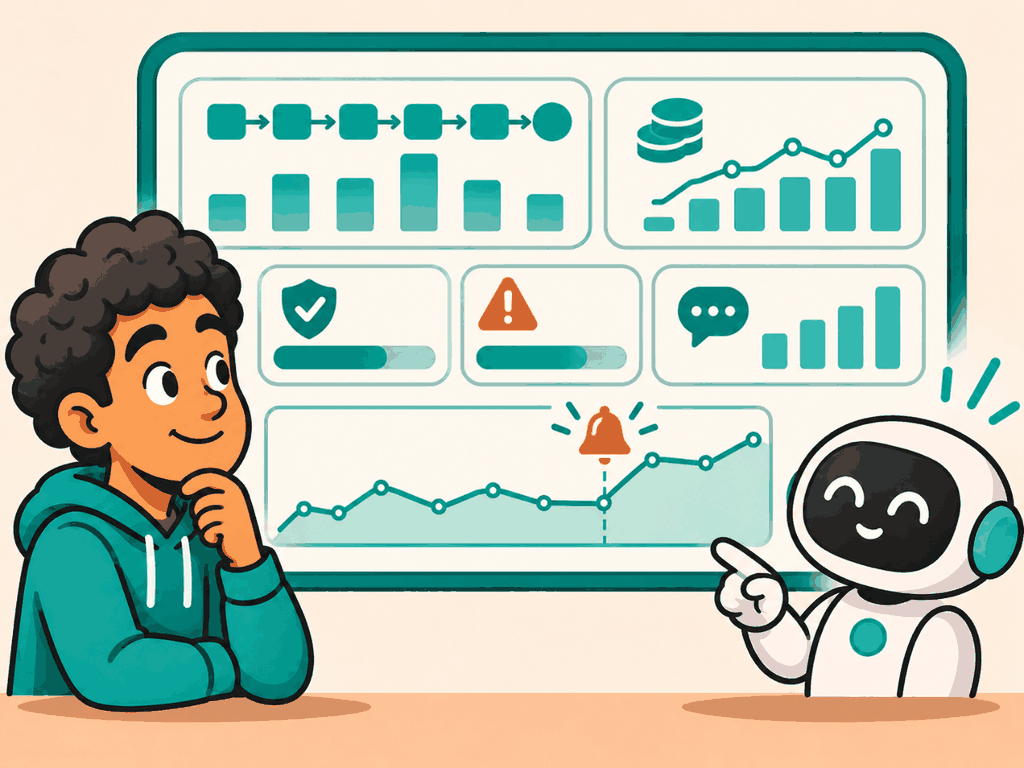
Latency per stage, tokens and cost per request, abstention and flag rates, feedback. Alert on changes, not just failures.
In detail
What to record. Trace id, user role (not identity, where you can), original and rewritten query, filters applied, candidate ids and ranks per retriever, reranker scores, packed chunk ids and token counts, model and prompt version, answer, citations, verification flags, abstention, per-span duration, feedback.
Privacy. Questions and answers can contain personal data. Mask what you can, restrict access and set retention (RAG-46).
Sampling. Keep full traces for a share of traffic and for every error, flag or thumbs down; keep metrics for all.
The code
Try it in Python
import time, uuid, contextlib

class Trace:
    def __init__(self, question, role):
        self.data = {"trace_id": uuid.uuid4().hex, "question": question, "role": role, "spans": []}

    @contextlib.contextmanager
    def span(self, name, **attrs):
        t = time.perf_counter()
        rec = {"name": name, **attrs}
        try:
            yield rec
        finally:
            rec["ms"] = round((time.perf_counter() - t) * 1000, 2)
            self.data["spans"].append(rec)

tr = Trace(question, role="customer")
with tr.span("bm25") as s:
    s["ids"] = [c.id for c in bm25_search(question, 10)]
See it
What we measured
Measured · per-stage latency, median over 47 golden questions
Polder corpus, 34 recursive 512 token chunks, laptop CPU, Node. bge-small q8 for the query, bge-reranker-base q8 for 10 candidates. Model generation not included.
Measured 2026-11-04 with corpus/scripts/measure-part-8.mts. Generation time needs model calls: not measured yet.
Try it on a real example
A trace of one question, measured on our pipeline: “How much notice is given for a price change during a fixed term?”
trace (median timings over 47 questions, laptop CPU)
Retrieval time is almost all reranking. Without spans you would not know which step to speed up.
Choosing
Use it when, avoid it when
- A trace id per request, returned to the client
- Spans per stage with ids, ranks, tokens and time
- Logging only question and answer
- Keeping full traces with personal data forever
What it costs · A little code per stage and storage for traces; sample full traces at scale.
In production
Build three views: a request view (one trace, every span), a stage view (p50 and p95 latency, cost per stage over time) and a quality view (abstention, verification flags, feedback by slice). Alert on change: a rising abstention rate after an index swap is often the first sign of a broken build.
Watch out
Common mistakes
- Observability is for outages. In RAG it is mostly for quality.
- Model calls are the only slow part. Our reranker took 1.4 s before the model was even called.
- More logs are always better. Personal data in logs is a liability; log what you need.
Check yourself
Remember this
Remember these
- Give every request a trace id and return it with the answer.
- Record each stage: inputs, outputs, ranks, tokens, time.
- In our pipeline, reranking was over 99% of retrieval time.
- Tie feedback to the trace id so bad answers can be replayed.
Say it in an interview
- 01Every request gets a trace id, with a span per stage, returned with the answer.
- 02I log the rewritten query, chunk ids and ranks per retriever, prompt tokens and model version.
- 03In my pipeline reranking was 1.4 s of retrieval time; everything else was under 4 ms.
- 04Feedback is tied to the trace, so a bad answer can be replayed and diagnosed.
- 05Traces follow privacy rules: masking, access control and retention limits.
Quick quiz