Chapter 3 · concept 3 of 6 · show all
2Tokens, cost and your first RAG
4Chunking
- 4.1Why we chunk, and the main chunking strategies
- 4.2Structure aware chunking and tables
- 4.3Chunk size, overlap and token based sizing
- 4.4Contextual chunking and late chunking
- 4.5Parent child and multi representation indexing
- 4.6Chunk metadata, provenance and the chunking debugging playbook
- Chapter overview
7Finding the right chunks
8When retrieval fails
Tables, images and mixed content
How to turn tables, charts and images into text that search can find and a model can read correctly, and why tables deserve their own tests.
A real question
Why does the assistant quote the wrong number from a table?
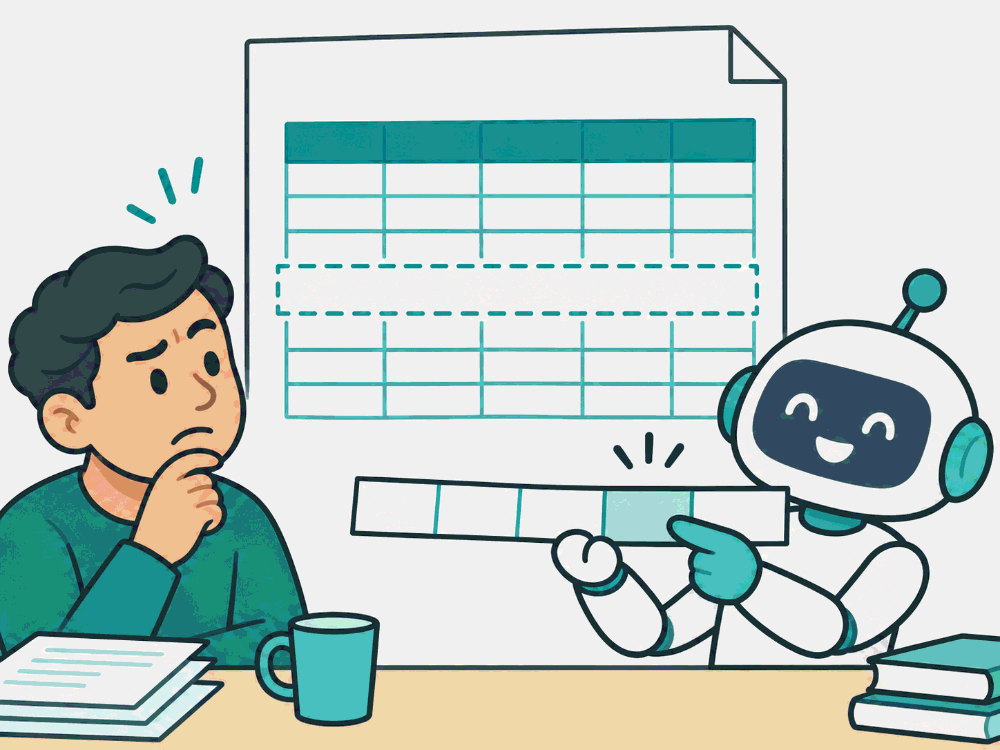
Because the row reached it without its header, or cut in half. A number only means something next to its column name.
The problem
Why this matters
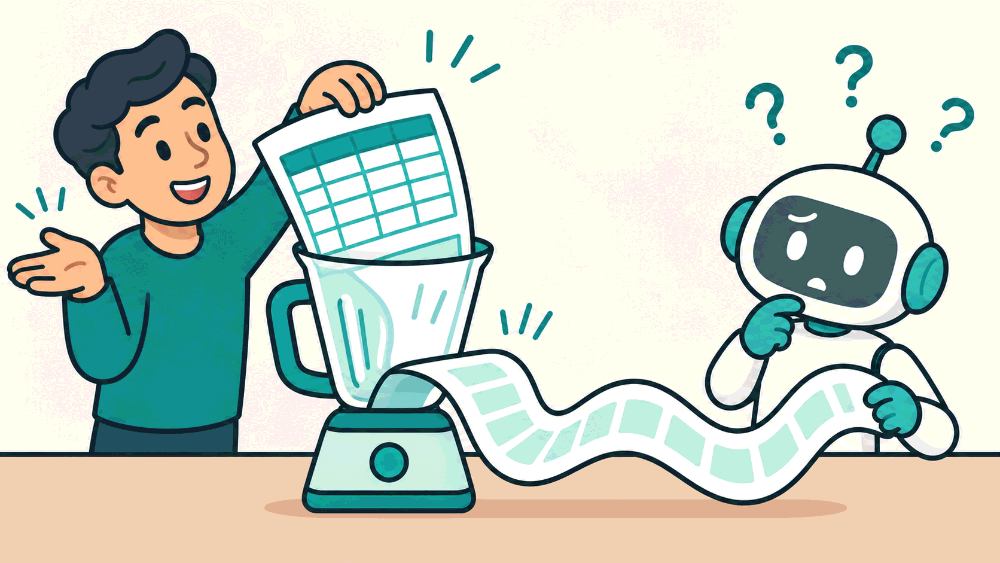
A table is just text. The model will work out which number is which.
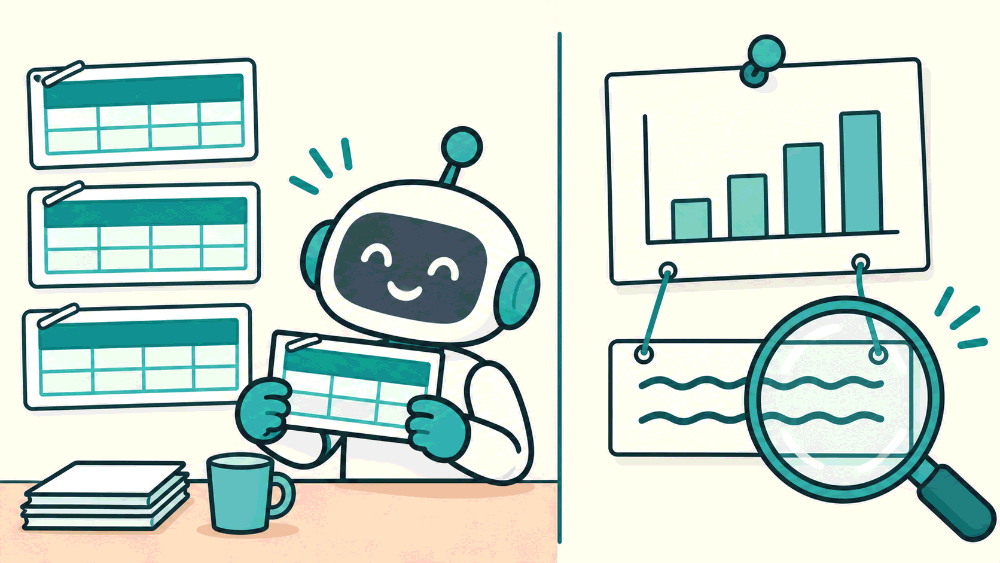
Without the header row, “60.5% | 61.9%” could be any two years. Tables need their header with every row, and images need a caption to be searchable at all.
Why not the simpler way
The simple way treats a table like any paragraph. The parser often flattens it into one line of numbers, the chunker may cut it in half, and the model then reads "2024 61.2 58.9" with no idea which number is which. Images are worse: a chart or diagram with the key fact becomes nothing at all, because search only sees text.
The idea
The idea in plain words
Give every non-prose element a text form that keeps its meaning. A table keeps its header with every row, or becomes one short sentence per row. A chart gets a description of what it shows and its key values. An image or diagram gets a caption, ideally written by a person or a vision model, and the caption is what gets indexed.
A good museum audio guide describes the painting, so you understand it even with your eyes closed.
How it works
Step by step
 1
Keep small tables whole
If a table fits in one chunk, keep it in one chunk, with the heading above it.
 2
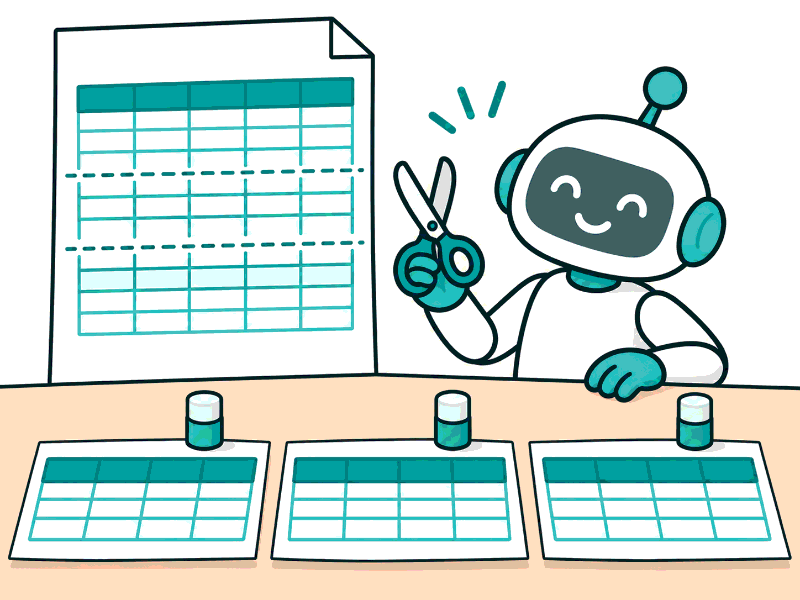
Split big tables by rows
Cut only between rows, and copy the header row into every part.
 3
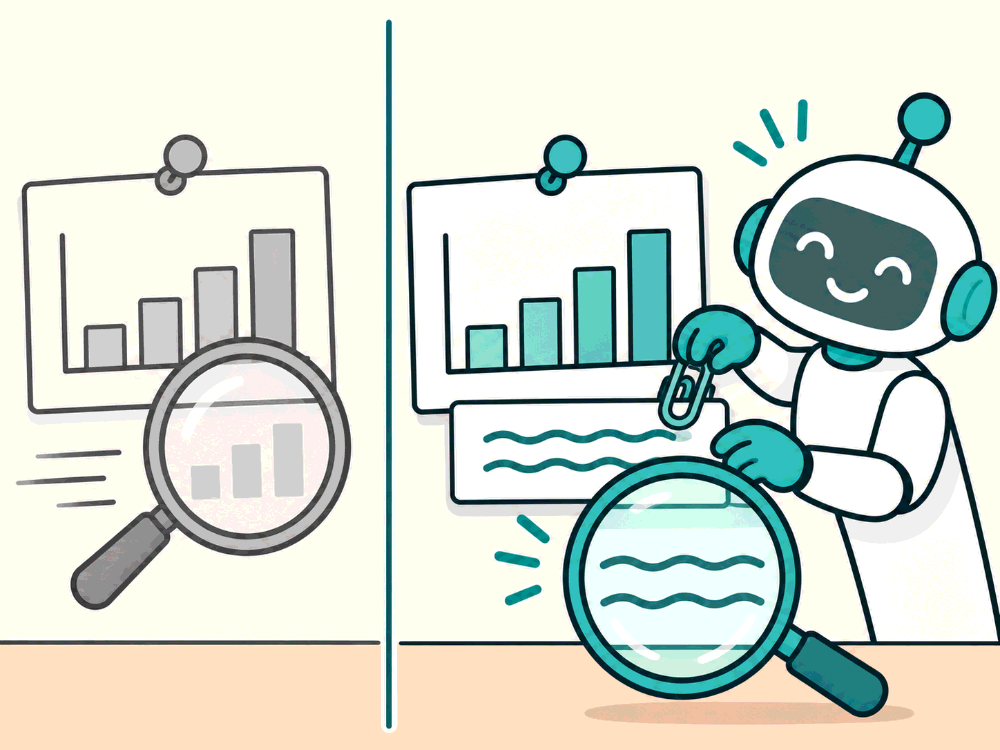
Give images a caption
Search reads text only. A chart with the key fact needs a written caption, linked to the image.
In detail
Tables. Keep small tables whole as markdown. For large tables, split between rows and repeat the header, or render each row as "column: value" pairs. Keep the table's title and the section heading with it. For numeric tables that users query by value ("which product costs under 20 euro?"), also load them into a database and answer those questions with a query.
Images and charts. Extract them with their position, write or generate a caption, and index the caption with a link back to the image. If a vision model writes captions, check a sample, because a wrong caption is a confident wrong fact.
Mixed pages. Keep the order: a caption belongs next to the paragraph that refers to it.
The code
Try it in Python
def rows_as_text(header: list[str], rows: list[list[str]], title: str = "") -> list[str]:
    """One self-contained line per row: every value keeps its column name."""
    prefix = f"{title}: " if title else ""
    return [prefix + ", ".join(f"{h} {v}" for h, v in zip(header, row)) for row in rows]

print(rows_as_text(["Code", "Meaning", "Cause"],
                   [["E4012", "Mesh pairing failed", "Mesh extender on old firmware"]],
                   title="FiberBox error codes"))
See it
What we measured
Measured · table questions with the answer passage in the top 3
The 8 golden questions answered from a markdown table, vector search, bge-small-en-v1.5. The corpus has no images.
Measured 2026-11-03. Not measured yet. Planned: render each table row as 'column: value' sentences, re-embed, and compare with the markdown form on these 8 questions; add an image with a caption to test captions.
Try it on a real example
A real question: “What was the cost to income ratio in 2024?”
Polder Bank annual report · end of chunk 2
| Cost to
Start of chunk 3
| Return on equity | 9.1% | 8.4% | +0.7 pt |
The row is cut inside a cell, and chunk 3 has no header. Nothing says that 61.9% is the 2024 value.
Choosing
Use it when, avoid it when
- Small tables whole, large tables split by rows with the header repeated
- Captions for every image or chart that carries a fact
- Tables flattened into one line of numbers
- Indexing images without any text form
What it costs · Table handling needs a parser that detects tables. Captions need a person or a vision model call per image, once per document version.
In production
Tag every table question in your golden set and report its score separately; table failures hide inside an overall number. Keep the original table or image next to its text form, so the answer can show the real thing. Review generated captions like any other content: they are part of your knowledge base now.
Watch out
Common mistakes
- The model will work out the table. Only if the header and the row arrive together.
- Images do not matter for RAG. If a fact is only in a chart, it does not exist for search until it has a caption.
- Tables are rare. In this corpus, one question in six depends on one.
Check yourself
Remember this
Remember these
- Every table row needs its column names to mean anything.
- Keep tables whole, or split between rows and repeat the header.
- Images and charts need a caption before search can find them.
- Here, 128 token chunks cut 2 tables in half; 512 token chunks cut none.
Say it in an interview
- 01Tables, charts and images need a text form that keeps their meaning before indexing.
- 02Table rows always carry their column names, or the numbers mean nothing.
- 03On my corpus 8 of 47 questions depend on a table; fixed 128 cut 2 tables in half.
- 04Images get a caption, and I review generated captions like any other content.
- 05I score table questions separately so their failures do not hide in the average.
Quick quiz